https://files.peakd.com/file/peakd-hive/shanibeer/xnmC5bdC-image.png
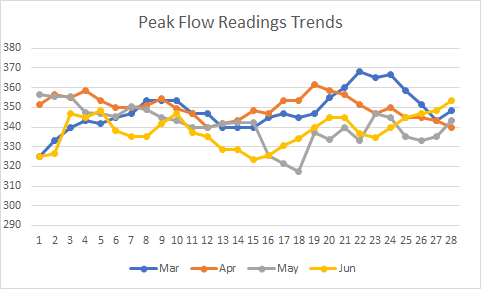
*Chart showing three day average for morning peak flow values during the pandemic. Day 1 on the chart is equivalent to 20th day of each month. High: 3-day avg = 368, actual = 375; Low: 3-day avg = 317, actual = 300.* Peak flow readings measure the capacity of the lungs to expel air in litres per minute. They are taken using a peak flow meter, a simple, portable, easy to use device. The readings for an individual can be compared with "normal" values for the population, taking into account height, age and sex. However, "normal" is very individual. Peak flow meters are one of the tools used to diagnose and manage asthma. My "normal" is a range of 345-360 l/min depending on many variables including things like levels of tiredness and air pollution. The blue line in the chart represents the first month of the pandemic: I achieved my highest reading ever then, 375 l/min, then, and several 370 l/min. The gradual decline shown in the grey line represents an infection and then the sharp drop shows the combined effects of infection and anti-biotics. In the yellow line you see the effects of a second, but less toxic, course of anti-biotics and then the gradual recovery. Even the lowest actual reading in this period was 300 - my "normal" in previous periods.
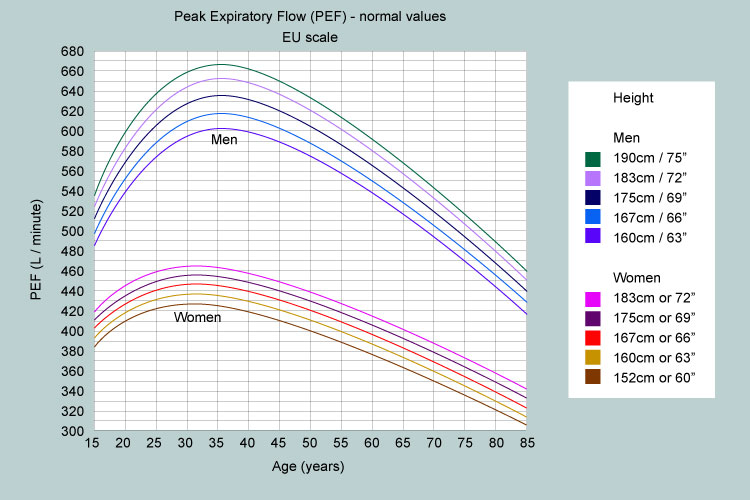
*[Source](https://mylungsmylife.org/topics/group-1/peak-flow/what-is-a-normal-peak-flow-2/) Chart with "normal" peak flow values depending on age, height and sex.* I was prompted to do this analysis by the positive feedback I received at my recent health check and the opportunity to work with a health trainer for six weeks towards achieving health improvement goals. Health improvement goals can be anything to do with lifestyle and behavioural changes: healthy eating, stopping smoking, better sleeping etc. I decided that I wanted to build my breathing capacity, shown by increased peak flow readings so that I'm getting a consistent three-day average of 380 l/min (or better). I'm going to do this by two things: * adding three thirty-minute sessions of Pilates each week. * moving my afternoon walk to the morning. I usually walk in the late afternoon or early evening and I use it as a boundary to my working day. However, it's also the time of day that traffic is building up. I've started going out about 6.30am when there is very little traffic. I've tested a set of Pilates videos, checking their effects and how long it takes me to recover. I'm starting with these: [Standing Pilates for Seniors to build strength and confidence (30 minutes)](https://www.youtube.com/watch?v=i3PYS_jsA1c&list=PL3-pUox5AQ_op4xBhHrzD95NsoMt86FeO&index=2&t=0s) [Mat Pilates for Seniors to build strength, confidence and flexibility (15 minutes)](https://www.youtube.com/watch?v=M9GFNDf9L30&list=PL3-pUox5AQ_op4xBhHrzD95NsoMt86FeO&index=5&t=914s) [Chair Pilates for Seniors - build core strength in a safe and gentle way (15 minutes](https://www.youtube.com/watch?v=LKQzfHYaHio&list=PLiAecv7YEF5j1Hy1Rf_pbVkeoFM8GLHro&index=5&t=384s) There are many others to choose from, ranging in length from 10 minutes to an hour, including Pilates for painful knees, building bone density, sessions for office workers and a lovely 15 minute gentle night time routine. I chose Pilates because of the focus on breathing control and the relationship between your breathing and control over your body. In addition to relieving stress (because you have to be in the moment and focus on what you are doing) and building strength, Pilates helps with balance, co-ordination, stamina and flexibility. The videos I've chosen are based on classes with participants ranging from 65 to 83 years of age. My goal over the next six weeks is to reach a consistent three day average of 380 l/min (I've already hit 390 l/min once this week, just messing about with testing the videos and moving my walk to the morning). Date | Target 3 day avg l/min | Actual 3 day avg l/min | Notes ---|---|---|--- 01/08/2020 | 345 l/min | 351 l/min | Starting three day average 08/08/2020 | 352 l/min | | 15/08/2020 | 359 l/min | | 22/08/2020 | 366 l/min | | 29/08/2020 | 373 l/min | | 05/09/2020 | 380 l/min | | 12/09/2020 | 380 l/min | |


Originally posted here: https://hive.blog/hive-120078/@shanibeer/health-goals-2020-or-peak-flow-readings-and-building-breathing-capacity
No comments:
Post a Comment