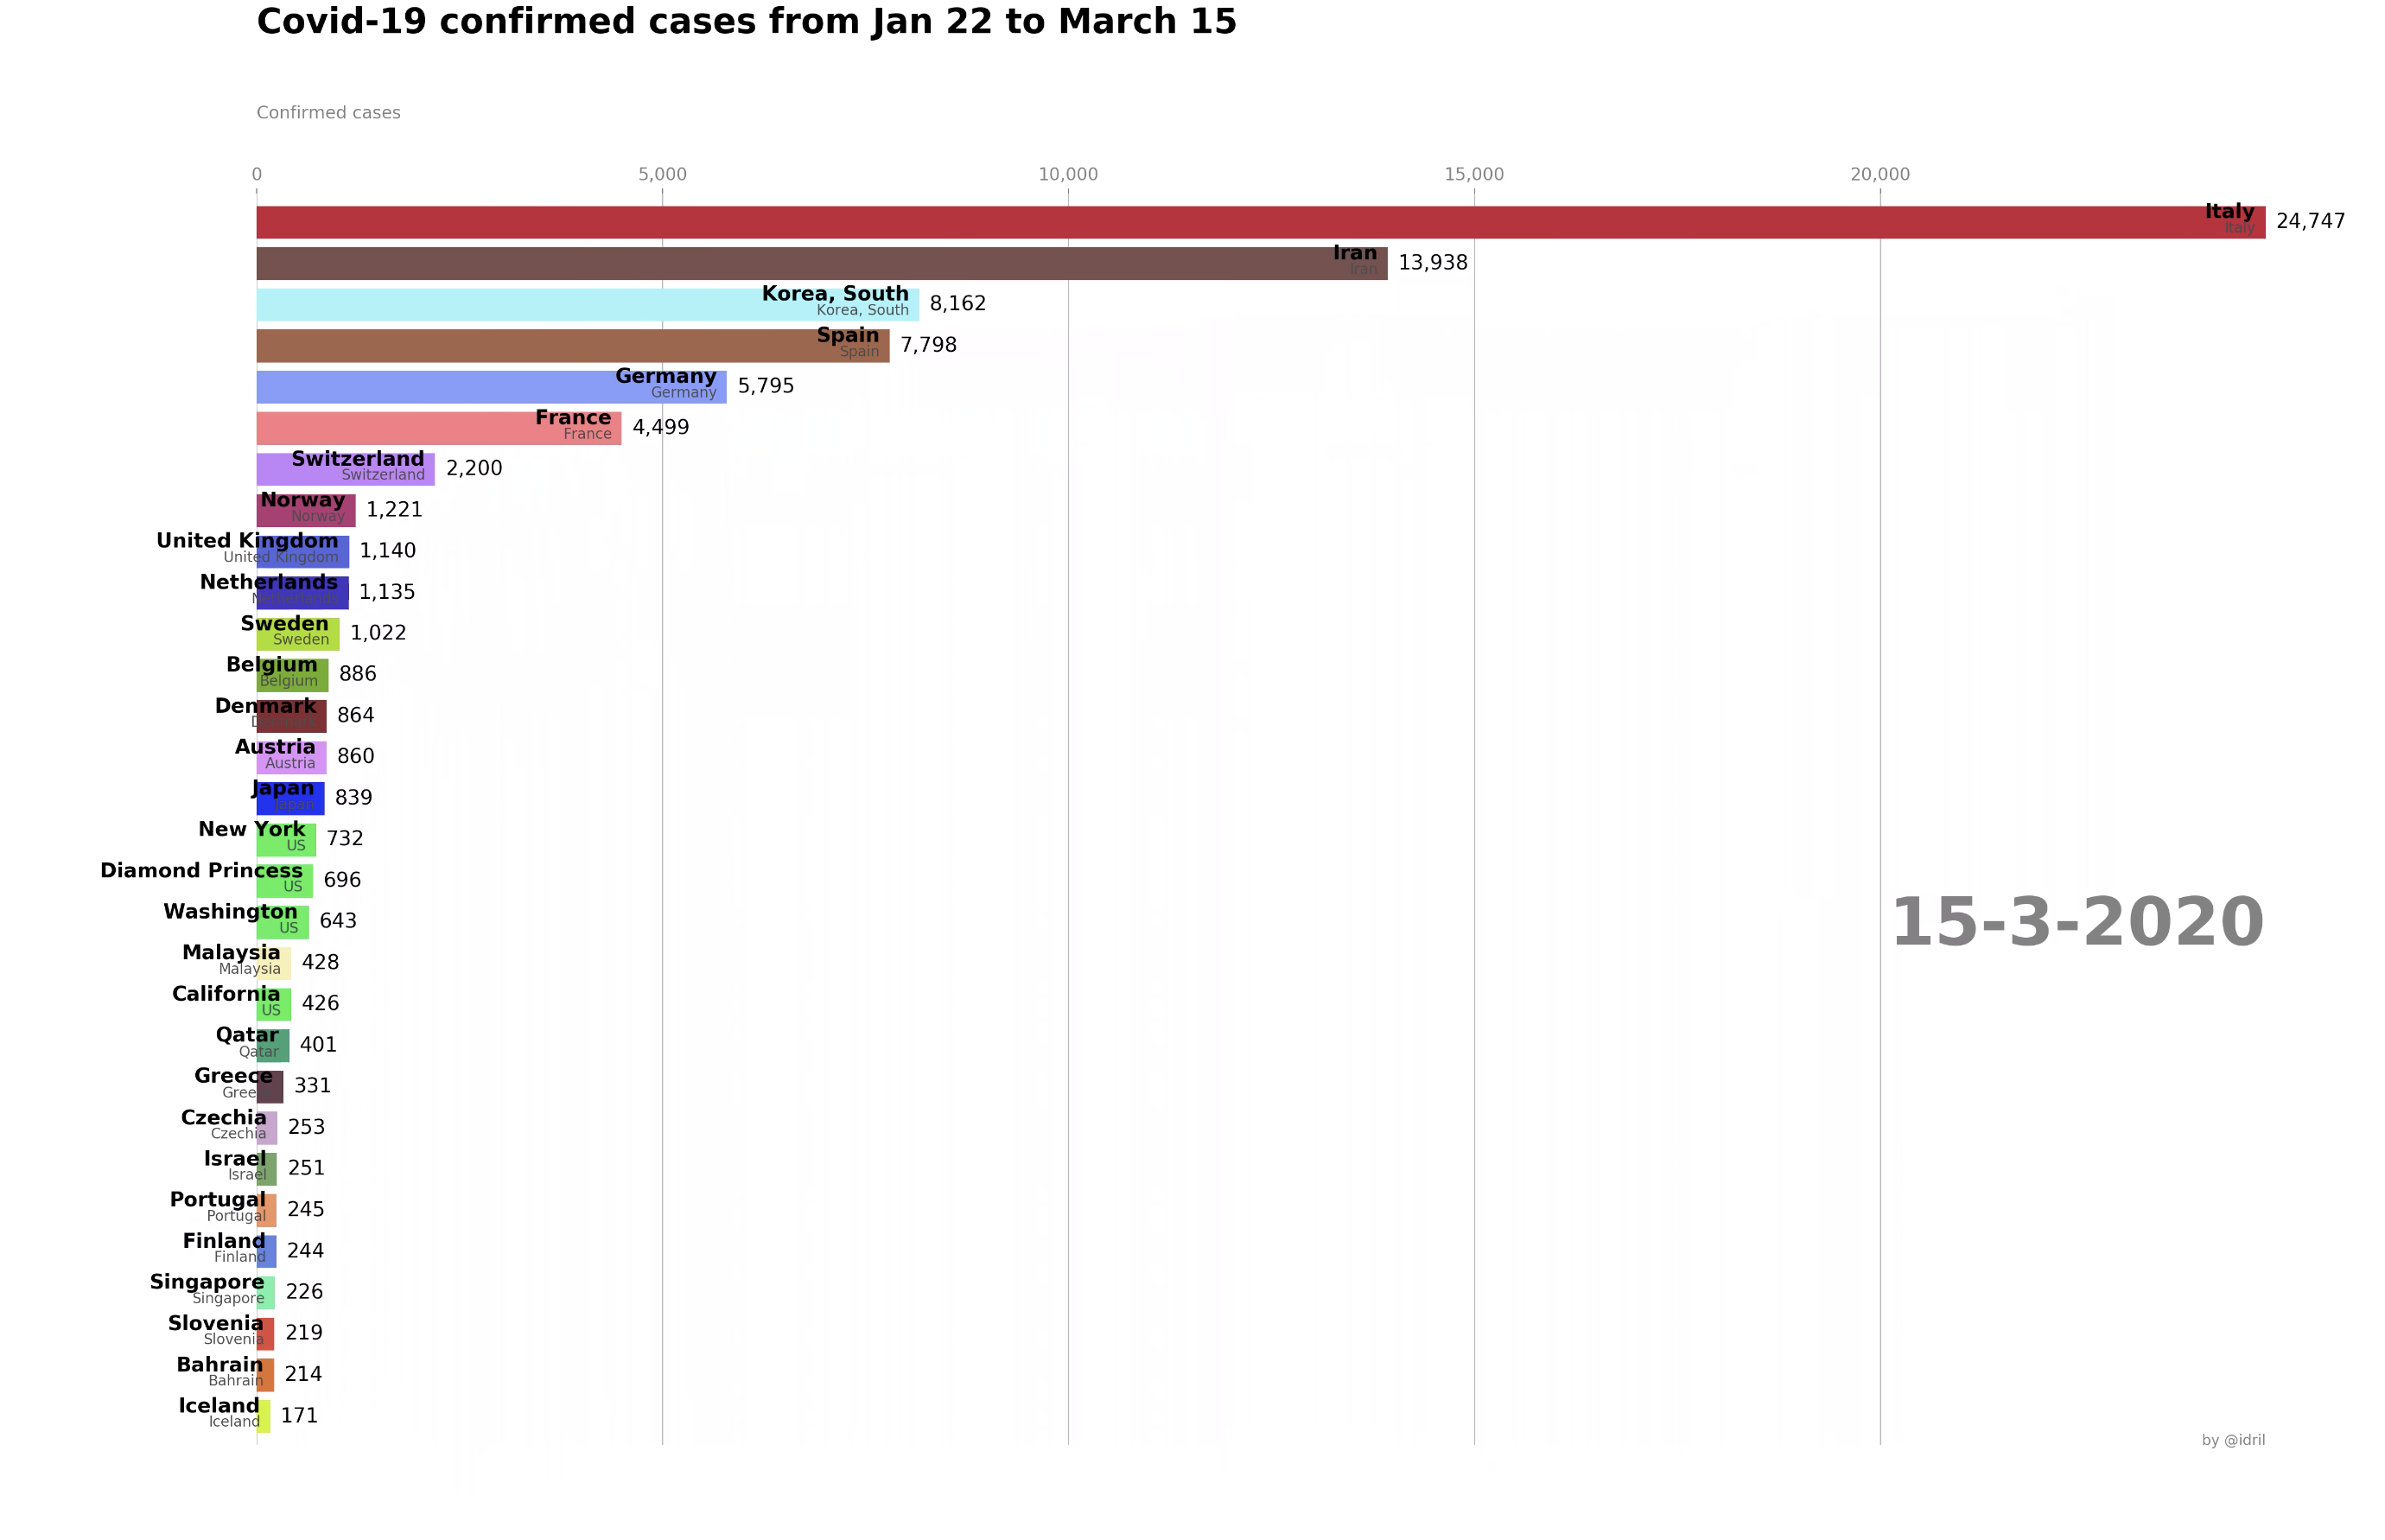
The quick changes in the evolution of the impact the Covid-19 virus has upon the world can be visualised in a race chart. Top 30 confirmed cases of Covid-19 displayed in a race chart capturing data from January 22, 2020 up to March 15, 2020. The data was released by [Johns Hopkins CSSE](https://github.com/CSSEGISandData/COVID-19) and is updated daily.
Originally posted here: https://steemit.com/covid19/@idril/covid-19-race-chart-top-30-affected-states-provinces
No comments:
Post a Comment